The Real State of Australia’s Property Market – 7 Charts That Matter
7 min read
Key takeaways
The Australian housing market remains far more complicated than many portray it to be.
The Australian housing cycle is turning up again; falling interest rates are the key driver, along with a chronic undersupply of homes of 200,000-300,000 dwellings.
This partly reflects a surge in building times; poor affordability is a key constraint though, but it varies significantly between cities; and finally, mortgage arrears remain low.
Average prices are expected to rise 5-6% this year boosted by falling rates but constrained by poor affordability.
By now, you’ve probably noticed the resurgence in our property markets.
Headlines are shifting from fear to FOMO again, and once more we’re hearing bold predictions from both extremes, the eternal optimists touting the tired “property doubles every seven years” mantra and the perennial bears warning of a crash.
The reality, as always, lies somewhere in between.
Australia’s housing market isn’t broken. But it is complex.
And if you want to build lasting wealth through property, you need to cut through the noise and understand what’s really driving the trends – not just today, but into the future.
Dr Shane Oliver, AMP’s well-respected Chief Economist, has recently shared seven insightful charts that help make sense of what’s happening beneath the headlines.
Let’s unpack them together.
1. The property cycle is turning up—again
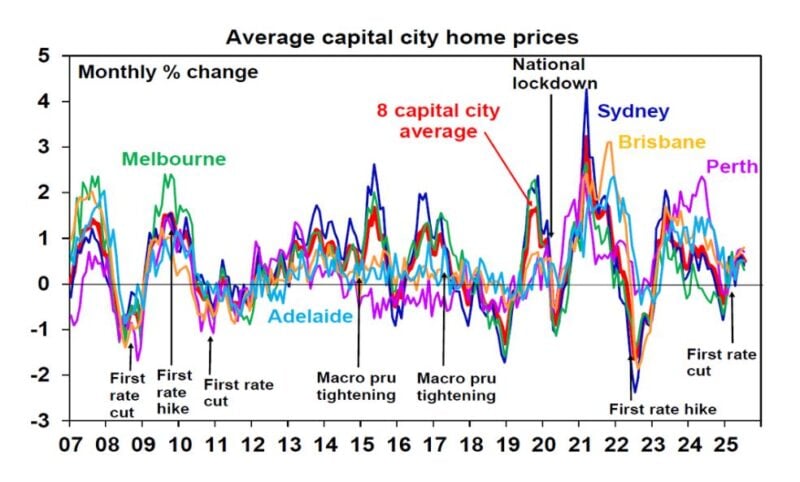
After a minor pause earlier this year, Australia’s property market is back on an upswing.
According to CoreLogic data, national home values are rising again, with a likely 0.5% gain this month alone.
Source: AMP
What’s notable is that this isn’t just the previously strong performing cities of Brisbane, Adelaide in Perth anymore.
Cities that were previously lagging: Melbourne, Hobart, Canberra, Darwin, are joining the party.
This kind of broad-based upswing is a clear sign of a market cycle in motion – not a one-off blip according to Shane Oliver.
And savvy investors know that this phase of the property cycle create opportunity.
2. Interest rates are (still) a key driver
To put it simply: when interest rates fall, borrowing capacity rises, and property becomes more attractive.
So it’s no coincidence that property prices started to rebound as rates started easing earlier this year.
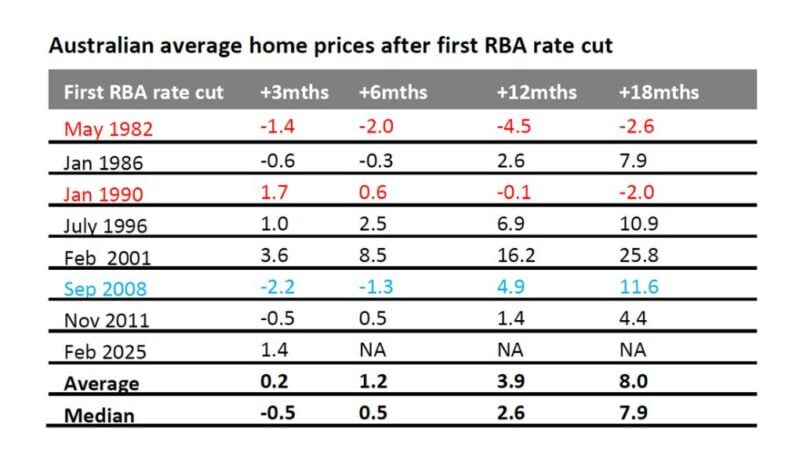
Dr Oliver makes a strong point: in five of the past seven RBA rate-cutting cycles since 1982, home prices rose significantly over the following 12 to 18 months, provided we didn’t fall into recession.
The AMP base case now includes a series of 0.25% rate cuts starting in August, then again in November, February and May.
Source: AMP
Dr. Oliver suggests that if the labour market continues to soften, we could even see back-to-back cuts sooner than expected.
However, the previous two rate cuts and the expectation of easier monetary policy are already fueling renewed buyer confidence.
But remember, these tailwinds won’t benefit everyone equally. Location, property type, and strategy still matter.
3. Chronic undersupply is the real elephant in the room
Forget the populist blame game about negative gearing or investors, Australia’s biggest housing issue currently is lack of supply and not property speculation.
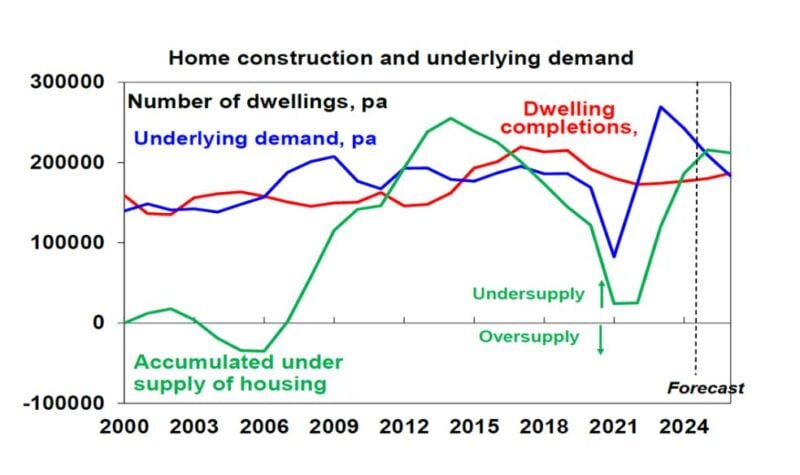
Since the mid-2000s, our population has grown rapidly thanks to strong immigration, but housing completions just sorry okay thank you very much. I enjoyed my lunch.haven’t kept pace.
Dr Oliver estimates the national housing shortfall is at least 200,000 dwellings, and possibly closer to 300,000 depending on household formation assumptions.
Source: AMP
This persistent imbalance between demand and supply is the structural force behind long-term price growth.
Fact is, property prices don’t just rise because of investor sentiment – they rise when more people want homes than there are homes to go around.
4. Home building times are blowing out
To fix this undersupply, we don’t just need more homes, we need to build them faster and more efficiently.
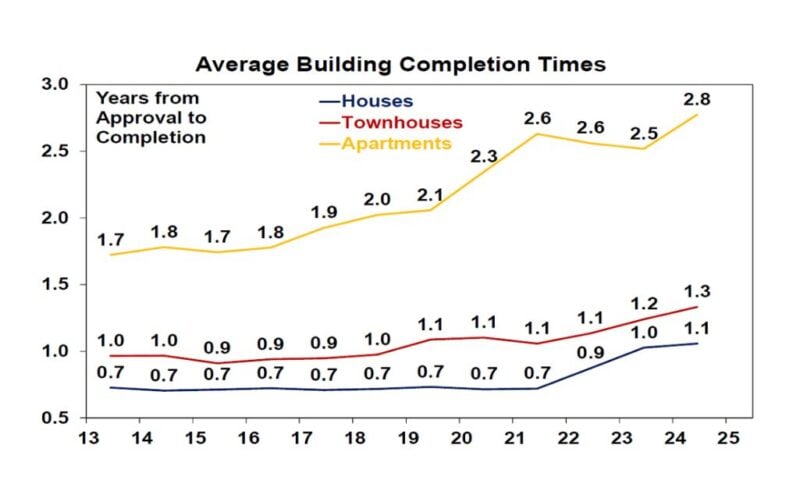
Yet the time it takes to complete a dwelling has ballooned.
Over the past decade, house construction timelines have grown by 57%, and unit builds have taken 65% longer.
Source: AMP
Why? A toxic mix of planning red tape, higher construction costs, and labour shortages.
Yes, immigration has been moderating lately. But that alone won’t fix the problem.
We need meaningful reforms to boost construction capacity, things like streamlining approvals, encouraging smaller dwellings, and smarter material use like pattern plans or timber over brick and concrete.
And critically, governments need to stick to their promise under the National Housing Accord: building 1.2 million new homes over five years.
5. Yes, Australian property is expensive, but that’s only part of the story
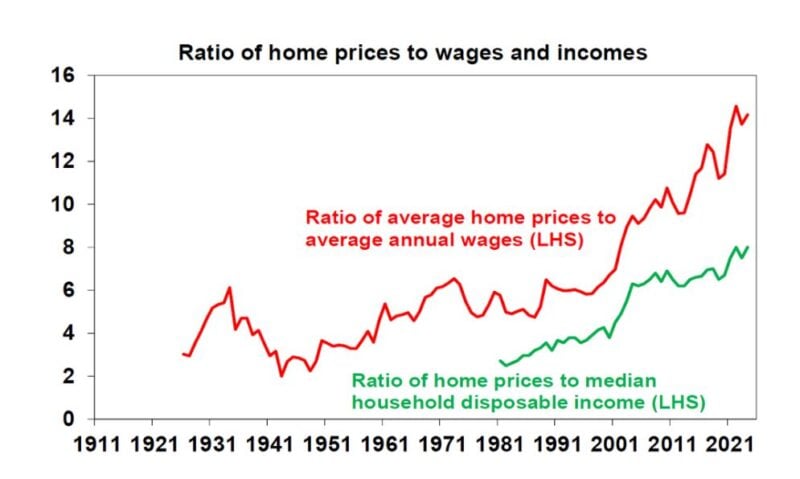
Affordability is clearly deteriorating, and it has been for decades.
In his article Dr. Oliver points out that:
-
It now takes the average Aussie nearly 10 years to save a 20% deposit, compared to just 4 years in the 1980s.
-
House prices relative to wages and household incomes have surged.
-
The house price-to-rent ratio (our version of a “P/E” for property) is about 30% above its long-term average.
Source: AMP
This price pressure doesn’t mean a crash is imminent. But it does mean the upside in the current cycle could be capped.
High prices combined with high debt levels create financial vulnerability if unemployment rises or if mortgage stress increases.
But for property investors, especially those with solid equity and buffers in place, this isn’t a red light, it’s a yellow one.
Be selective, stick to investment-grade assets, and focus on long-term performance rather than short-term noise.
6. It’s not one property market, it’s many
We love to talk about “the Australian property market” like it’s one big beast.
But it’s really hundreds of micro-markets moving at different speeds.
Source: AMP
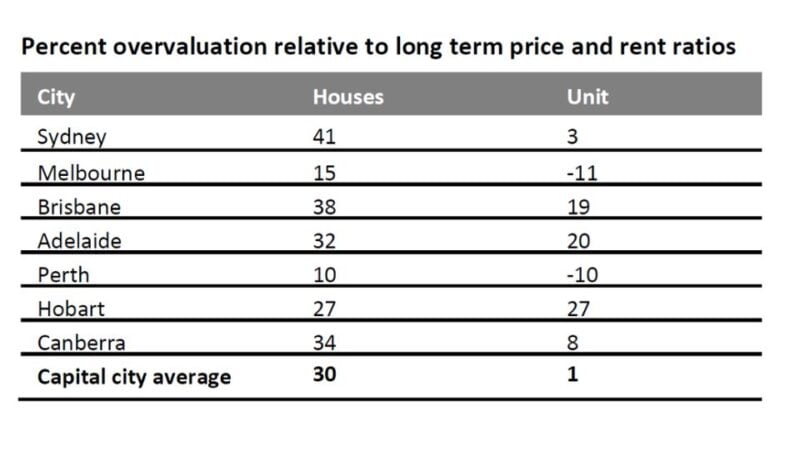
Dr Shane Oliver’s valuation table shows this clearly. He believes:
-
Houses are around 30% overvalued on a price-to-rent basis.
-
Units, on the other hand, are only 1% overvalued—which suggests better value and less downside risk.
-
Perth and Melbourne now appear to be the least overvalued capital city markets for houses.
-
Both cities show undervaluation in the unit sector.
This sort of dispersion is gold for investors.
It means you don’t need to wait for a national upswing – you just need to find the right city and the right asset type.
7. Mortgage arrears remain low
Despite all the talk of mortgage stress, actual arrears remain extremely low, sitting below 1% on average, and still low even for high LVR or high debt-to-income borrowers.
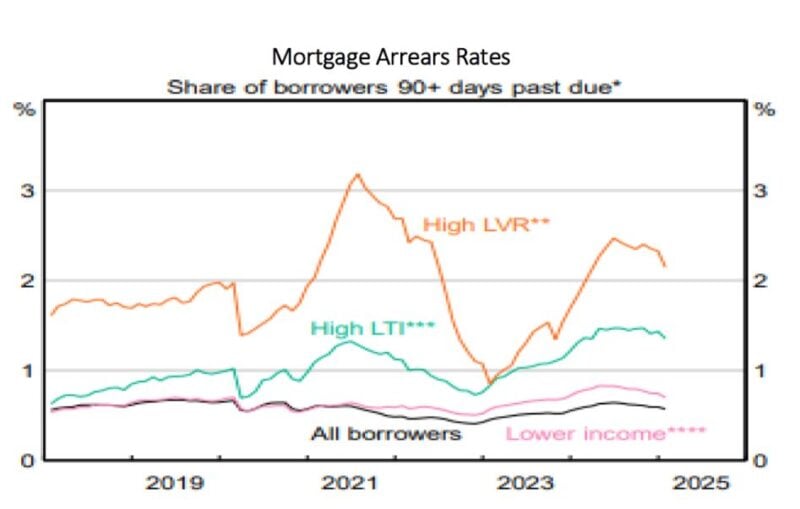
This reflects several things:
-
Prudent lending standards
-
Strong employment levels (so far)
-
Large household savings buffers from the COVID period
Unless we see a sharp spike in unemployment, we’re unlikely to get a wave of forced sales that would push prices down meaningfully.
So where are we headed?
Dr Oliver’s base case? A 5–6% gain in national property prices this year, underpinned by lower interest rates and structural undersupply, but limited by poor affordability.
There are risks both ways:
For investors, this environment rewards strategy, not speculation.
Buy well-located properties with strong fundamentals and decent rental yields.
Avoid the froth, ignore the spruikers, and don’t fall for the doom-and-gloomers either.
This market isn’t cheap, but for the strategic, it’s still full of opportunity.